|
A Bit of Intro If I recall correctly, I completed the first version of this data architecture diagram in 2012 when we used terms like "road map" and "blueprint" Back then, along with different terms, we were also using traditional SSIS, SSAS-MultiD and SSRS tools. Now we live in the world of cloud everything, although we are still driving from SRC-to-DST (source to destination). I'm up for whatever terminology you want to use, but can we agree that we are surely on a different highway? For my classical BI Blueprint, click here, but to see an Azure road map for BI, please take a look below. Disclaimer: I create a different diagram for every engagement, so think of this as a suggestion, not a mold. 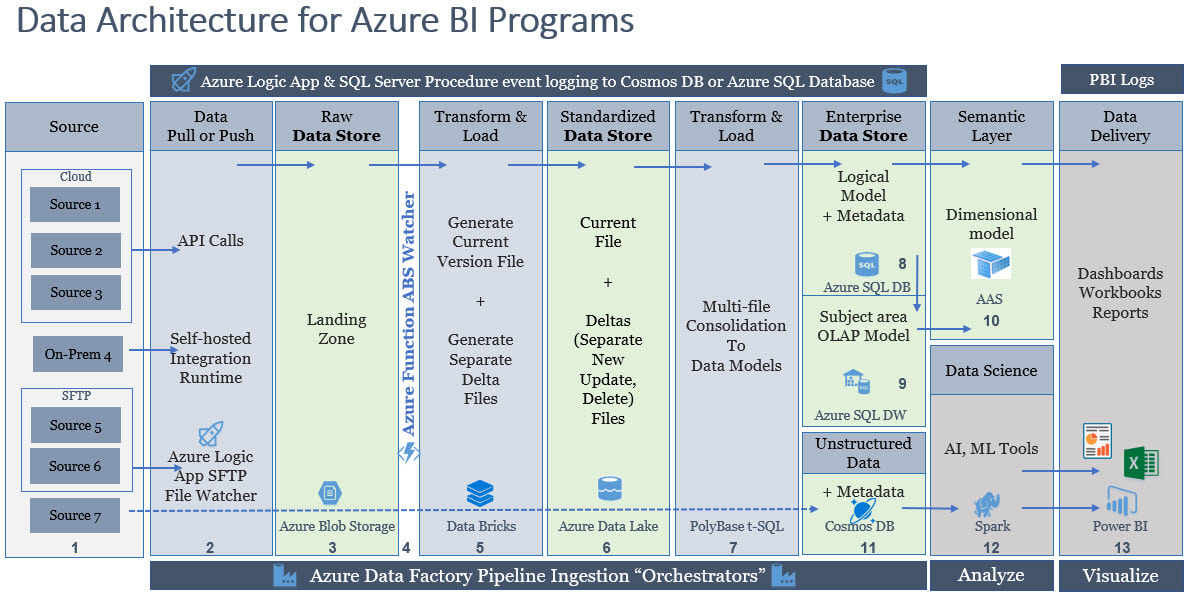 Azure Data Architecture BI Talking Points:
BI Advice from the University of Hard Knocks:
Conclusion of the Matter: I am not explaining every column in the data architecture because the columns in the above diagram are not applicable to everyone. For example, almost everyone needs a semantic layer, but not everyone needs a logical data store for operational reporting. Column #5 can be done in Spark as well as Data Bricks; instead of my telling you what the best solution is, let's talk about it. For every column there is a good, better and best solution, and good heavens (!) not everyone needs a thirteen point data architecture! All things in moderation, right? I am asking, if you have taken the time to read this, please start planning before you start building! Opening Power BI and mashing up data from three different sources is generally not a scalable solution. Get started with a data architecture diagram and build a better BI house!
3 Comments
Situation: Many CRM data source use varchar() GUID-looking values for primary keys. This blog post applies to any source system for a reporting and analytics project that uses text/string/character values to join transactional tables. Below are example PKs from the SalesForce Opportunity table. 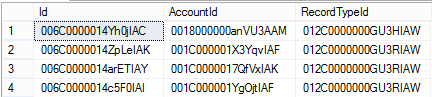 If you have the privilege of a data warehouse, the extract, transform and load (ETL) process often, as best practice, replaces source system PKs with data warehouse identity seed integer values. However, with the trends in data mashups (Excel Power Query and Power BI Query Editor), this may not be happening. Also, some PKs, like the ones pictured above, are often brought forward into a data warehouse as a secondary "business key" and users are pulling them into their report data sources for drill-down / source system lookup capabilities. Problem: String values do not compress as well as integer values, so when using these varchar() PKs in multidimensional cubes, tabular models, Excel Power Pivot and Power BI (PBI) Desktop, file or memory sizes increase exponentially. As of January 2017, PBI in memory files have a maximum file size of 250MB. This can be highly problematic as explained by my Pragmatic Works colleague, Rachael Martino, in her SQL Saturday presentation Tips and Techniques for Power BI. (You can find a corresponding blog post from Rachael here.) With her permission, I have borrowed the following screen print which shows the problem and resolution result clearly. 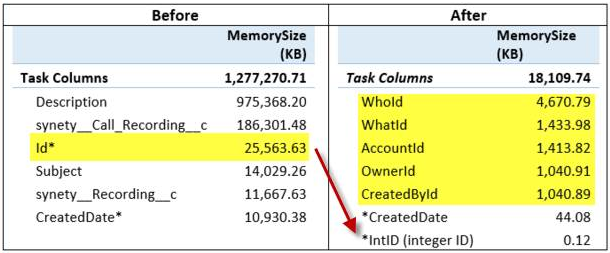 Summary Resolution: Assign a unique integer value to each varchar() primary key value. This may be easier said then done, but look at the result above. On the left is memory consumption "Before" by a SalesForce varchar() PK. When an integer value was substituted "After", memory size dropped from 25,563.63KB to 0.12KB. Resolution Illustrated: For the next screen print I totally cheated and used the t-sql ROW_NUMBER() and RANK() functions to illustrate my point and assign a unique integer to each varchar() value. However, there are at least three potential problem here: 1. NewAccountID and NewRecordTypeID share the same integer value. This may be okay -- it depends how your ETL is written. 2. If you are working in Excel Power Pivot, SSAS data source or Power BI query editor, you do not have the ETL capabilities that will push these same integer values into multiple child tables. 3. If you are working in Azure DW, as of January 2017 Azure DW did not have auto-incrementing identity seed capabilities, but that is a semi-related topic for another day. 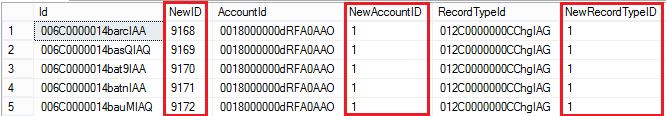 Creative Problem Solving, Please: When I find myself in a bit of a fix like this, the answer is always the same: What is best for reporting and analytics (R&A)? ETL (or ELT) is not the spoke of my BI Wheel. In fact, data transformation frequently writes a check payable to Father Time to make a better R&A experience. This is another one of those instances. You should handle this in your source-to-data warehouse data integration step.
As a last resort, you can play ROW_NUMBER() and RANK() games inside your data source views. You can also continue to use these varchar() PK values for table relationships inside of SSAS tabular models, but be sure to 'Hide from Client Tools' so they don't end up being pulled into PBI memory or used as slicers or column values. If you are using tabular models and include these columns in your design, there is no way around paying the memory price in your SSAS processed model. Multidimensional cubes will throw a warning for bad cardinality of a dimension attribute, but if you do not place them inside any *.dim, and only use them for relationships in your DSV, you should be okay. There really is no happy ending here if you cannot get rid of these things from within medium to large sized data sets. Let's remember, each MS BI tool is designed for a specific purpose. SSRS is a reporting tool although it can also provide dashboards. Power BI Desktop is designed for analysis of aggregated data -- not paginated granular reporting. Consequently, if we use each MS BI tool for what it does best, a SSAS Action or Power BI link to a granular SSRS report can be a good solution here. "Simply" pass a set of input parameters to SSRS and present to the user only the varchar() values needed. To create data models for business intelligence, you first need to understand your BI Blueprint, then it is pretty critical to truly understand the difference between reporting and analytics (R&A) data models. Modeling data for R&A happens in pipes #5, #7 and sometimes (but not optimally) in the DSVs (data source views) found in pipe #8. Keeping in mind that tables arranged in a circle does not a star schema make, below is a slide that articulates in part the difference between the two. Think of reporting as a pile of Tinker Toys -- you SELECT tables and JOIN...JOIN...JOIN to a bunch more. Analytics is about flattened "denormalized" data arranged into subject area dimensions and measure groups, preferably with pre-processed totals, stored like Rubik's Cube. 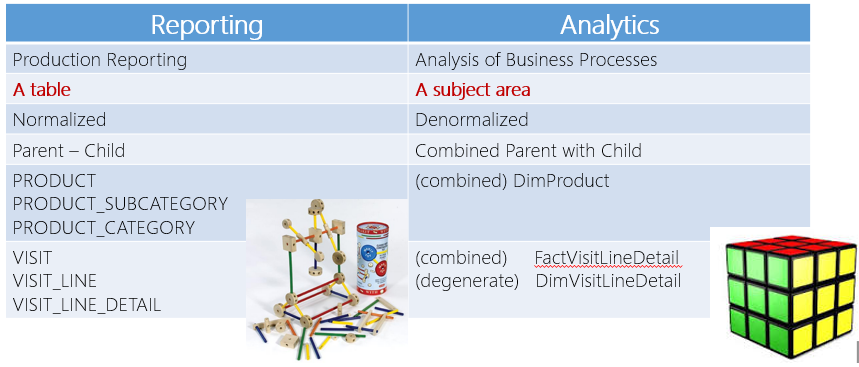 If you are serious about data modeling for business intelligence, dig deep into the following concepts each which are worthy of individual blog posts.
When I get my blogging juices on, I'd like to post a bit about each one. In the interim, you can contact me in About. |
 RSS Feed

