|
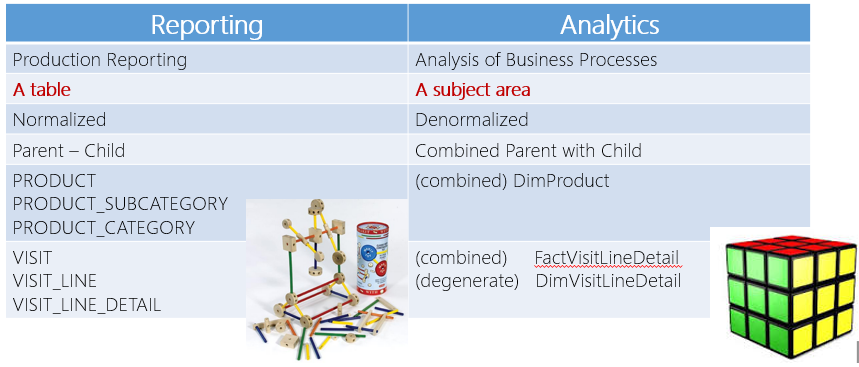
To create data models for business intelligence, you first need to understand your BI Blueprint, then it is pretty critical to truly understand the difference between reporting and analytics (R&A) data models. Modeling data for R&A happens in pipes #5, #7 and sometimes (but not optimally) in the DSVs (data source views) found in pipe #8. Keeping in mind that tables arranged in a circle does not a star schema make, below is a slide that articulates in part the difference between the two. Think of reporting as a pile of Tinker Toys -- you SELECT tables and JOIN...JOIN...JOIN to a bunch more. Analytics is about flattened "denormalized" data arranged into subject area dimensions and measure groups, preferably with pre-processed totals, stored like Rubik's Cube. If you are serious about data modeling for business intelligence, dig deep into the following concepts each which are worthy of individual blog posts.
When I get my blogging juices on, I'd like to post a bit about each one. In the interim, you can contact me in About.
1 Comment
Julie Kalu
6/27/2017 10:45:03 pm
I finally saw your presentation on dimensional data modeling. Fantastic job!! Very informative and just the right pace. Why aren't you running a BI boot camp?
Reply
Leave a Reply. |
| Microsoft Data & AI | Modeling for BI |

 RSS Feed

