• Home
  • Modeling for BI
  • DBA
  • Azure
  • SSIS
  • SSAS
  • SSRS - Reporting
  • PBI - Analytics
  • Consulting
  • About
Microsoft Data & AI

Modeling for BI

Data Architecture for Azure BI Programs

7/27/2018

2 Comments

 
A Bit of Intro
If I recall correctly, I completed the first version of this data architecture diagram in 2012 when we used terms like "road map" and "blueprint"  Back  then, along with different terms, we were also using traditional SSIS, SSAS-MultiD and SSRS tools.  Now we live in the world of cloud everything, although we are still driving from SRC-to-DST (source to destination).  I'm up for whatever terminology you want to use, but can we agree that we are surely on a different highway?  For my classical BI Blueprint, click here, but to see an Azure road map for BI, please take a look below.

Disclaimer: I create a different diagram for every engagement, so think of this as a suggestion, not a mold.
Picture
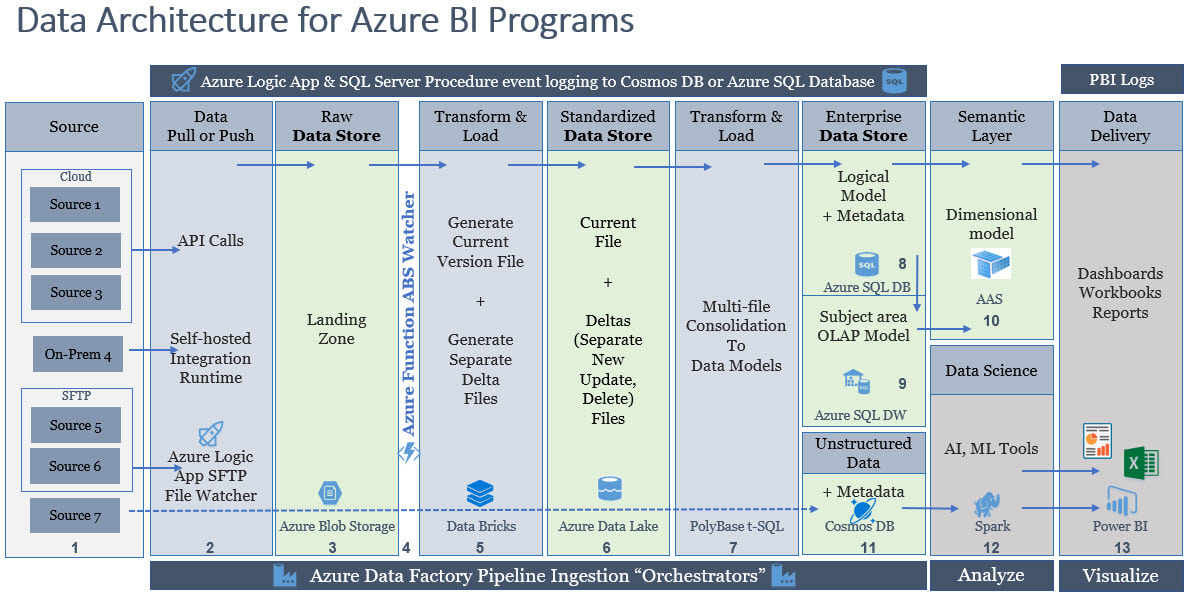
Azure Data Architecture BI Talking Points:
  1. Start thinking "event", "file based ingestion", "streaming" and "near real time" replacing the former batch mode  thought process.
  2. Adopt an "I can, but I won't" methodology as you reach for optimal Azure solutions.  Identify the intended purpose for each Azure tool and stick with it.  There shouldn't be data transforms happening in every column, and stand alone semantic layers growing in every Power BI report.
  3. Simplistic repeatability is the key to successful CI/CD (continuous integration, continuous delivery).  Data enters ABS (Azure Blob Storage) in different ways, but all data moves through the remainder of the ingestion pipeline in a uniform process.  
  4. Consider hiring a former web developer.  More and more Azure offerings are coming with a GUI, but many will always require .NET, R, Python, Spark, PySpark, and JSON developer skills (just to name a few).  You will need these skills for columns #2 and #5 above.
  5. Be prepared to replace SSIS functionality with ADFv2, v3, v4 (eventually), and Sql Server User Stored Procedures.  I think of Azure Data Factory v2 as an "orchestrator" right now, but I ADF Data Flows is Microsoft's next step in replacing SSIS.
  6. Build current and future state data architectures.  This foresight helps to ensure a solid foundation as you build your BI house in increments.  It is generally a misstep to plan a Taj Madashboard, that needs information for every system in your company, as your first deliverable.  This is also contrary to an Agile manifesto.  Keep something in your back pocket.  Deliver business value in consistent increments.
  7. Model your data stores around reporting and security requirements, not what is easiest for data ingestion.
  8. Start small and scale up with all your Azure resources.   This is the premise of an Azure cost-effective solution.

BI Advice from the University of Hard Knocks:
  1. Every decision point should be what is best for reporting and analytics, not data transform and load.  Please see my BI Wheel for success.  The wheel spokes change with Azure, but the theory does not.
  2. Require uniformity and avoid one-off creative solutions.  Make your first exception on the last day of the 5th year after you have gone to production.
  3. Don't complicate your data architecture just because it's new, challenging and fun.  Always produce a finished product that can be handed off to an entry-level developer.  More than one person in the BI team should be able to service each part of the architecture.
  4. Don't design your data architecture around 10% of your user base i.e. the number of people who may hold a master's degree in statistics at your company.
  5. Design a BI solution without end-user input, and they will not come.  Attitude is 50% of the success of your BI solution.  Give strategic company users an investment in the project, and then they will adopt it.

Conclusion of the Matter:  I am not explaining every column in the data architecture because the columns in the above diagram are not applicable to everyone.  For example, almost everyone needs a semantic layer, but not everyone needs a logical data store for operational reporting.   Column #5 can be done in Spark as well as Data Bricks; instead of my telling you what the best solution is, let's talk about it.  For every column there is a good, better and best solution, and good heavens (!) not everyone needs a thirteen point data architecture!  All things in moderation, right?  

I am asking, if you have taken the time to read this, please start planning before you start building!  Opening Power BI and mashing up data from three different sources is generally not a scalable solution.  Get started with a data architecture diagram and build a better BI house!
2 Comments

Your BI Blueprint: Road to a Successful BI Implementation

11/6/2015

4 Comments

 
Inserted below is a slide I use when talking about data modeling for MS BI.  (If you have brought me into your company for MS BI mentoring or training, you already have a version.  :-) ).  I am posting it here because if you are planning a BI project, you need your own version of one of these!  Why?
  1. Avoid common mistakes, like jumping from pipe #1 to pipe #9 (that is the roadmap for operational reporting).
  2. Make a conscious decision to possibly skip certain pipes vs an oversight that might require you to backtrack and redo later on in your project.
  3. Provide adequate timelines to administration because you haven't missed planning a critical step.
  4. See the need and plan for hardware for each pipeline.
  5. Provide a non-technical explanation of BI steps to Administration.

Please allow me to encourage you -- open Visio and get blueprinting!!  For a deeper dive into a BI blueprint for your company, drop me a note under the About  section of this site.
​
Picture
4 Comments

The Big Picture: What is in the Center of Your BI Wheel?

5/24/2015

0 Comments

 
Picture
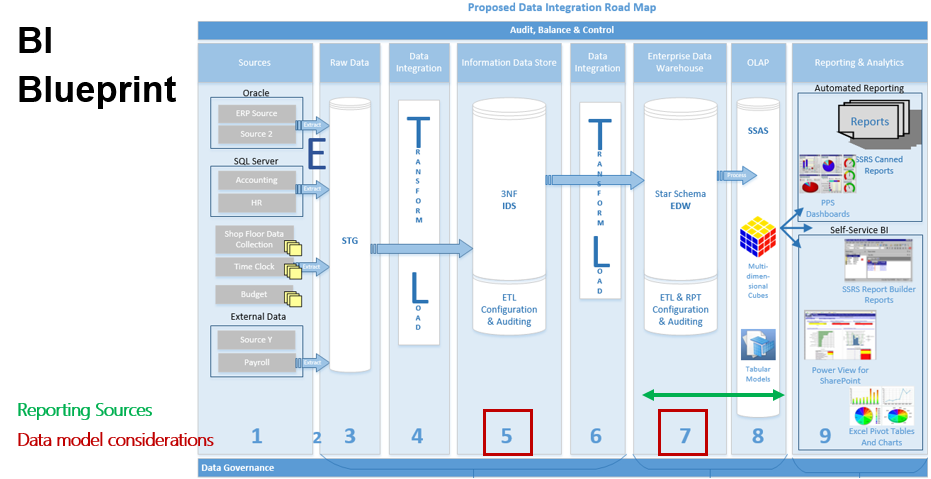
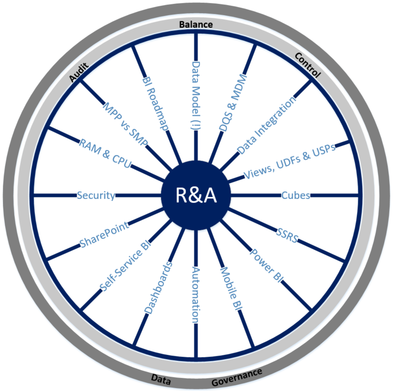
What purpose is driving your BI project?  (I am talking about true OLAP in this blog post, not OLTP.)  When you have an ETL or hardware choice to make, you make your decision based on what is best for what?  Please allow me to suggest to you that a BI project should have one (1) central purpose: reporting and analytics (R&A).  Period.  The end.

If this is true, (and I ask this with kindness), how then can hardware, network, your data model, data integration and data visualization choices be made without R&A clearly defined?

For instance, I have often thought often that the most critical wheel spoke of a successful BI implementation is the data model.  "Build it and they will come" is not a really good catch phrase for a BI project because you may end up building a football stadium when your users intended to play basketball.  You can retrofit your football field, but wouldn't it have been a lot better (and cheaper) if you had built a basketball court to start?

Possible indicators that a BI model was not written with R&A in mind:
  1. There are composite keys used to join tables
  2. My time dimension table (like DimDate or DimCalendar) does not have a smart PK (primary key) of YYYYMMDD.
  3. 99.9% of the reports have to remember to filter "WHERE IsDeleted = False"
  4. I have to UNION measures together from multiple FACT tables.
  5. There is no single-view-per-table design methodology in my EDW whereby omitting a necessary level of protection between my EDW and my consuming applications
  6. I have to replicate simple addition and/or subtraction calculations in my SSAS, Excel and SSRS DSVs (data source views)
  7. When the majority of my R&A requirements are "current attribute", not "attribute value at time of fact", yet the FK (foreign keys) in my FACT table(s) all require me to join "WHERE fact.FK = dim.PK and fact.date between dim.EffDate and dim.ExpDate"
  8. My dimension foreign key in my FACT table(s) does not allow me to join to my SCD (slowly changing dimension) table(s)  with
Let's talk about the infrastructure team for a minute.  When we told them we were putting up a SQL Server data warehouse, did we provide anticipated data size over the next 12 and 24 months, AND take the time to explain that SQL Server works best when a table to assigned to a filegroup that in turn is dedicated to physical resources, not virtual?  Did we draw out our BI blueprint showing separate DEV and PROD environments and sizing all requirements for reporting workloads taking into consideration time zones and fluctuating business hours?  I find that most infrastructure teams are eager to please, but it is my responsibility to look at the big picture and plan hardware and network requirements NOT FOR ETL alone, but ultimately for R&A.

Possible indicators that hardware was not specified with R&A in mind:
  1. There are not separate DEV, QA prePROD and PROD environments
  2. SSIS and SSAS are running on the same box 
  3. There is only one SSRS server or SSRS is running on the SharePoint box
  4. The PROD environment is virtualized
  5. The BI team is expected to create an enterprise solution using SQL Server STD edition

I am sure you can come up with actual indicators for your own projects, but the point is this:  EVERYTHING we do in our BI projects should take into consideration R&A.  Pick a wheel spoke -- any wheel spoke -- when you draw your blueprint for that spoke, UNDERSTAND your complex business logic and KNOW your reporting requirements.

What do you think?  Here are a few talking points for your BI team:
  1. Returning to the top of the post, how will you make hardware, network, data model, data integration and data visualization choices without R&A clearly defined?
  2. Whiteboard your own BI wheel.  What are your wheel spokes?
  3. Now put an inner tube on your wheel called "audit, balance and control".
  4. Put a tire on your wheel called "performance expectations".
  5. Last, shine up that wheel with "data governance".

How do all of your choices support R&A?

0 Comments

The Big Picture: A BI Project is Like Building a House

5/24/2015

0 Comments

 
Picture
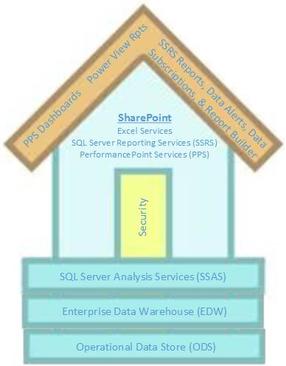
When you build a house, you start from the foundation and work up.  When you build a BI solution, it is logical to start from the foundation and build up as well.  However, what I see often is someone working on the house roof (reporting) before there is a foundation (data model, integration, security ...).

We all understand that some houses are pre-fabricated and the individual pieces are build independent of each other and then somehow come together in one miraculous final push to production.  However, in my opinion, that is not the "industry standard" and as a BI consultant, I will rarely recommend any other BI build method other than "from the ground up". 


I consider the house roof, reporting and analytics, to be the "fun" part of every BI project because it is the most visible.  (I have observed that those who get to write reports and create dashboards often progress quickly to hero status.) However, it is the responsibility of each team member of a BI project to produce a product that has these characteristics:
    1.  Accurate (is dependable and truthful)
    2.  Scalable (can grow and change in step with business fluctuations)
    3.  Discoverable (you can find things you want, such as metadata, measures and attributes)

Talking Points:
  1. If you have data transformations happening in SSIS, your EDW views, your SSAS MultiD and tabular model DSVs, in MDX and DAX formulas,, and in Excel Power Query and PowerPivot, how accurate do you anticipate your DW information to truly be?  Where there is a question and you have to prove the actual version of the truth, how many places do you want to 1.) search and then 2.) fix?
  2. If you have star schema, snowflake schema and 3NF (3rd normal form) data models in addition to aggregated data marts and disparate data stored only in Excel or SharePoint lists (for possibly very good reasons), how easy will it be to add a new subject area, corporate department, or newly acquired company?   
  3. Very few companies can build the Taj MaBIsolution right out of the gate.  Often MDM (master data management) falls prey to budget and time constraints.  However, we are building a house here and if my house has four kitchens (customer tables), where should we tell the marketing department to eat their lunch (discover the most recent customer data)?
  4. In MS BI, there are many ways to get to the same finish line, but where will you decide is the proper place for ...
                    Data integration -- SSIS, SSAS, views, USPs, UDFs, DSVs, Excel
                    Self-Service BI -- PPS (performance point services), Excel, Report Builder
                    Automated Reporting -- SSRS, Excel
                    Source code control -- TFS (team foundation server), corporate file store
                    Documentation -- in-line code, TFS, file store, DMVs, Visio, Word documents

0 Comments

    Categories

    All
    Analytics
    Architecture
    BI Blueprint
    Denormalization
    Dimensions
    Mesaures
    Modeling

    RSS Feed

    View my profile on LinkedIn
    Tweets by @SqlServerSME
Powered by Create your own unique website with customizable templates.
  • Home
  • Modeling for BI
  • DBA
  • Azure
  • SSIS
  • SSAS
  • SSRS - Reporting
  • PBI - Analytics
  • Consulting
  • About