|
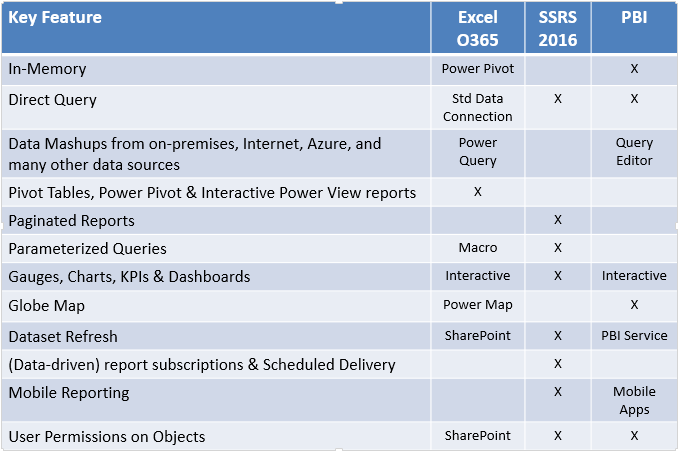
In my Integrating Power BI with SSRS 2016 and Excel webinar, I shared the following Microsoft business intelligence report tool comparison. A colleague recently asked for a copy so I thought it might be worth a blog post. The point I'd like to make is that Microsoft has specialized tools for specific purposes. Because there is quite a bit of overlap, so I always suggest drawing out a BI Blueprint so the BI team is clear on what tool to use for what purpose.
SSRS has fantastic graphical abilities, complex filtering, actions and drill through to other reports, but it isn't interactive. What are the requirements for your company dashboards? Both Excel and Power BI Desktop have increasingly powerful data mashup capabilities, but is this where you have drawn in data integration on your BI Blueprint? (I sincerely hope not!) Just because you CAN [do something below] does not mean you SHOULD. I would not try and squeeze every company into the same BI Blueprint anymore than I'll declare here a global opinion on in-memory vs direct query. What are YOUR business requirements? What reporting and analytics features does YOUR business require? I will say this: I personally feel all reporting and analytics is helped out substantially by a SSAS semantic layer, but let us put that aside for now. Below is a matrix of how I see the MS BI tool stack ... today ... for this immediate moment. Tomorrow there will be new Power BI features and more SSRS integration options, but for now, this is how I see it from a 10K point view.
0 Comments
Leave a Reply. |
| Microsoft Data & AI | SQL Server reporting services |

 RSS Feed
