|
At the bottom of this blog post you will find the ZIP file referenced in today's webinar from Pragmatic Works. Webinar Talking Points: 1. SSAS Performance Optimization 10K Foot View 2. Profiler vs Extended Events 3. SQL Server Instance QueryLog Properties 4. SQL Server 2016 Profiler & Extended Events Demos 5. Interpreting Extended Events Data 6. Extended Events Integration with SSIS Demo ZIP File Contents: 1. Slide deck in PDF format with and without notes 2. XMLA scripts for creating, stopping, deleting extended events. (Also find these files here.) 3. T-SQL scripts for interpreting SSAS event data. (Also find these files here.) 4. Visual Studio Community Edition SSIS solution for warming multidimensional cache Thanks for coming!!
1 Comment
Extended Events (EE) is a great SQL Server tool for monitoring Analysis Services, both multidimensional and tabular models. I use EE primarily to answer five questions about SSAS. 1. Who is actually using our tabular models and multidimensional cubes? 2. How often is [someone] running queries? 3. What are my longest running queries? 4. For multidimensional cubes, and I missing aggregations? 5. For long-running queries, is the problem my storage or formula engine? I also like to use EE to warm the multidimensional cache after cube processing, but that is a subject for another blog post. The subject of this blog post is really about interpreting data captured by EE. Prerequisite: Knowledge of how to start, stop and import data from EE sessions. If EEs are new to you, I have a blog post on EE for Analysis Services Database Administration that might be helpful. This blog post assumes that you have already imported EE data into a SQL Server database table and are at the point of wanting to analyze that data. Summary: If you want to jump to the finish line, download the two files I've attached to this blog post. They are t-sql statements that read from EE SQL Server tables for both multidimensional and tabular models returning login, query durations, execution counts, storage and formula engine durations. Enjoy! Detail: The most important thing to understand when reading EE data is how EE reports storage and formula engine durations. Very simplistically, the storage engine is exactly what you think it is -- it stores the data. The formula engine does the number crunching. The first step in SSAS query optimization is to understand where you are paying the price of the query duration. Multidimensional Cubes 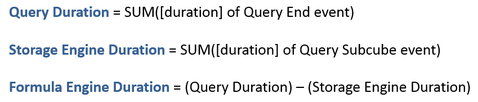 Tabular Models 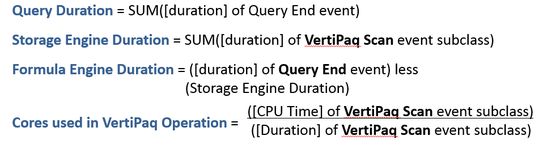 The attached t-sql documents have this all figured out for you, but I fully expect you to take these code samples and make them your own. For example, group the resulting row set ordering by QueryDuration DESC, or select for one particular user Id. Compare the storage and formula engine durations and email a SSRS report for percentages exceeding a predetermined amount. Basically, use EE to be proactive in finding long-running queries and don't wait for the help desk phone to ring. If working with multidimensional cubes, pay attention to the QuerySubcubeVerbose event. The query text will help you identify missing aggregations. Expert Cube Development with Multidimensional Models will give you more information on this. My experience has been that once I make sure all necessary hierarchies are in place, all fact tables are partitioned properly, aggregations have updated with usage-based aggregations, and poorly written MDX has been revised, I rarely have to spend time in the QuerySubcubeVerbose event. However, as a matter of last resort, this event has much complicated but informative query information. Files for Download
Issue: When working in Excel 2013 Prof Ed and a SQL Server 2012 multidimensional cube, you receive the following error when adding a hierarchy or attribute to the FILTERS section of the PivotTable Fields GUI. 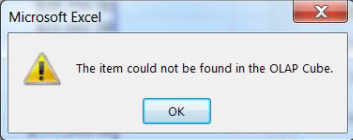 The above error is usually caused by an object that was removed or renamed in the cube. However, this was not the case for a recent client. I Googled the error (like you probably did to even arrive at my blog site), but found nothing except that an object was deleted or removed from the cube. As this was not our scenario, I'm doing this little write-up hoping that is will be helpful to someone in the same predicament.
Summary Solution:
Cause of the Error: Unknown. I have found on more than on one occasion that the underlying XML of multidimensional cubes becomes "out of sync". I realize this isn't a very technical response, but if you have spent time comparing "working" XML code to "unworking" code, you know that sometimes it is easier to just remove and readd the object. Resolution Logic: In the latest occurrence of this error, I worked through the following steps trying to find the cause before throwing in the towel and removing the dimension from the cube. It was determined that ..
It was a bit of work to remove a shared dimension from a large cube and re-add it, checking to make sure all cube relationships and properties remained the same, but in the end, this is what fixed the error. if you have come across this same problem and have found a better solution, please post it in blog comments. I'd like to hear your creative solution! I initially compiled this table in a Power Point slide deck when I was studying for my MCSE BI, so most likely the original source is from a Microsoft textbook, but you can also easily find this same information on TechNet. (https://technet.microsoft.com/en-us/library/ms174532(v=sql.110).aspx). I am posting this table for you because I often just want the abbreviated version and I appreciate the table view. 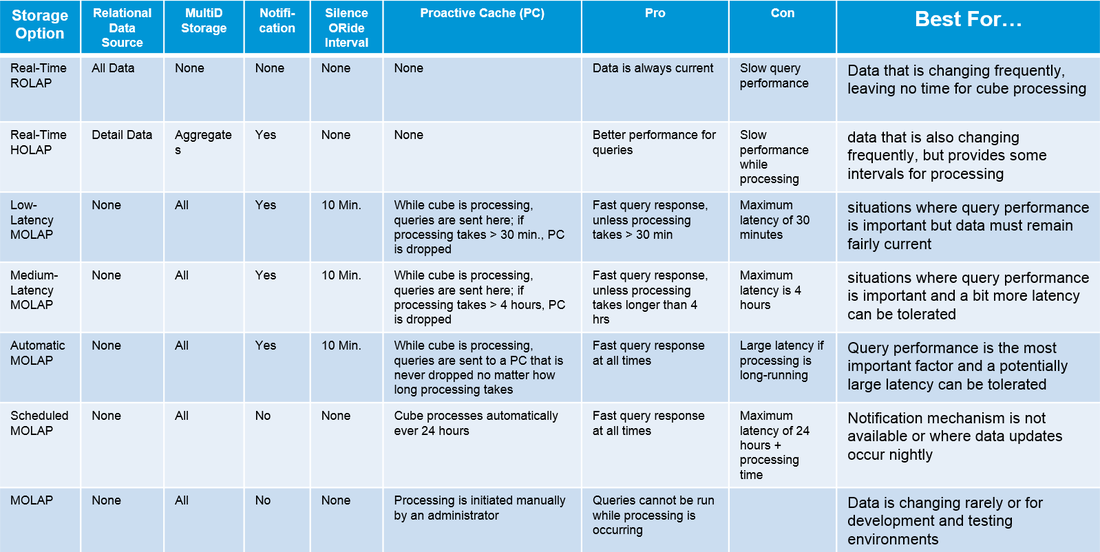 A few more notes on "cached" vs "DirectQuery", and DirectQuery Properties. 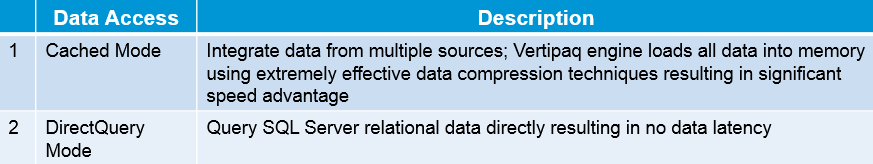 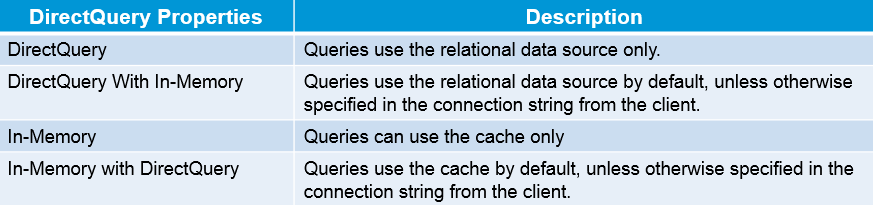 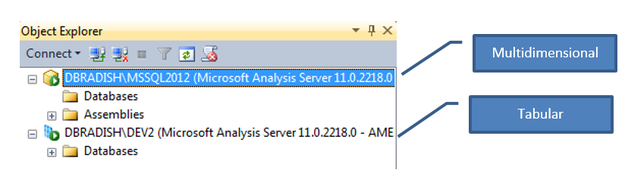 You can read up on how to do this on MSDN here (https://msdn.microsoft.com/en-us/library/gg471594.aspx), but below is a quick summary. The easiest option is to connect to SQL Server Management Studio and note the icon next to the server name in Object Explorer. An alternative is the read the XML in the MSMDSRV.INI file searching for “DeploymentMode”. 0 = multidimensional 1 = PowerPivot for SharePoint 2 = Tabular 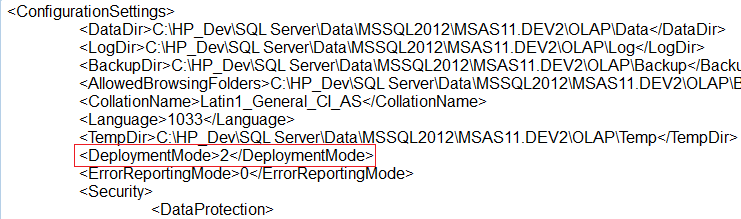 |
|||||||
| Microsoft Data & AI | SQL Server Analysis Services |
 RSS Feed
